
Modern IT environments are built through specialization. They must be operated through shared understanding.
Nearly every IT organization is aligned around technological domains. Network teams bring networking expertise, tools, and data. Infrastructure teams manage servers, virtualization, storage, and operating systems. Application teams and developers understand the code and the services it enables. Cloud teams operate in an entirely different ecosystem, with different platforms, skills, operating models, and often different visibility.
These silos are not inherently a failure of organization. They are a practical response to complexity. No single person can master every technology, vendor, platform, dependency, and architecture that supports a modern enterprise. Specialization is necessary. The problem begins when specialized teams also become isolated views of the environment.
|
THE CENTRAL CHALLENGE Our expertise is specialized, but our business services are interconnected. |
The Visibility Paradox
Most organizations have more operational data than ever before. Yet they still struggle to answer a deceptively simple question: Is the business service healthy?
Each team can see its own domain. The network team sees latency, packet loss, interface errors, and route changes. The infrastructure team sees CPU, memory, storage, and virtual-machine health. The application team sees response times, exceptions, dependencies, and releases. The cloud team sees native service metrics, control-plane events, and consumption. Each view may be accurate, but none is complete.
THE ELEPHANT PROBLEM
Every team sees a piece of answer.
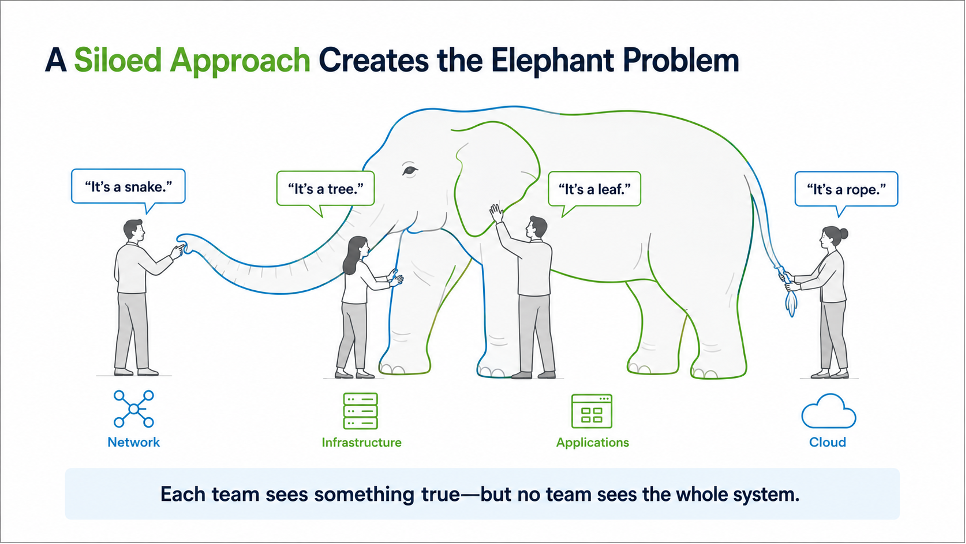
A localized view often tells only part of the story.
From Monitoring to Meaning
The visibility gap becomes most costly when a shared business service degrades. Consider a single critical-path server that is constrained by high CPU or delayed I/O. The infrastructure team may see the resource condition, but can anyone immediately determine which applications depend on it? Which customer journey is affected? Whether response time has crossed a business threshold? How many users are experiencing the issue? Whether revenue, care delivery, employee productivity, or brand trust is at risk?
Traditional monitoring often tells us that something has changed. Observability should help us understand what that change means to the services, teams, and business outcomes it affects.
Why the War Room Persists
When no common operational view exists, organizations recreate one manually. They assemble an IT war room and invite representatives from every domain to bring their portion of the evidence. The meeting becomes a human correlation engine: screenshots are shared, timelines are compared, dashboards are opened, and hypotheses are debated.
This is where the elephant problem becomes organizational behavior. Each team describes the incident from its own technically valid perspective. Because the full chain of dependencies is not visible, investigation can drift from finding the cause to establishing mean time to innocence. Proving that a team’s technology is not responsible so its members can return to other work.
The result is predictable: slower resolution, repeated handoffs, frustrated customers, duplicated effort, and friction among teams that should be collaborating around a shared outcome.
The Art of Observability
The Art of Observability is the disciplined practice of turning fragmented technical telemetry into shared operational knowledge. The art comes from deciding what matters, understanding how the pieces relate, and presenting that knowledge in a way that helps us act.
- Deconstruct the ecosystem. Identify the business services, critical paths, technology layers, external dependencies, and teams that collectively deliver an outcome.
- Define health at every layer. Determine the signals that define health at every layer and separate meaningful indicators from low-value data.
- Connect technology to service context. Map infrastructure and application relationships so a component condition can be understood in terms of downstream services, users, and business impact.
- Converge the right data in Splunk. Bring together logs, metrics, events, traces, alerts, topology, and business context across otherwise separate tools and platforms.
- Create operational knowledge. Correlate the data to reveal patterns, dependencies, blast radius, likely cause, and impact. Not merely a collection of individual alarms.
- Design for decisions. Present the knowledge through intentional dashboards and workflows that guide triage teams from symptom to scope, probable cause, and the appropriate owner.
|
THE FOUR RIGHTS: The right data • to the right people • at the right time • to make the right decision |
Dashboards as Decision Support
A wall of data is not operational awareness. A dashboard can contain dozens of panels and still leave the operator asking, “What am I supposed to do next?” Effective observability dashboards are intentionally designed as decision-support trees.
They begin with service health and business impact, then allow the operator to move naturally through scope, dependencies, contributing conditions, and ownership. A strong dashboard does not attempt to replace the subject matter expert. It gives the triage team enough connected knowledge to engage the right expert sooner and begin the investigation with relevant evidence already in their hands.
A Different Operating Model
This approach does not eliminate specialized teams or their domain tools. It creates a shared view of reality across them. Subject-matter experts retain the depth required to diagnose and remediate their technologies, while service owners, operations teams, and leaders gain the broader context needed to understand the impact and coordinate the response.
What Better Looks Like
The goal of the Art of Observability is simple: help organizations operate complex environments more effectively.
It is a measurably better way to operate complex technology environments.
- Fewer war rooms because common context is available before a major escalation begins.
- Empowered triage teams that can assess scope, impact, and probable ownership without waiting for every SME.
- Faster engagement of the right specialists, supported by a coherent timeline and relevant evidence.
- Shorter investigation and resolution cycles, with less time lost to duplicate analysis and defensive handoffs.
- A clearer connection between technology health, customer experience, operational performance, and business outcomes.
Observability is ultimately a shared-understanding problem. Technology teams will remain specialized because modern environments demand it. But the organization does not have to accept a fragmented operational picture as the inevitable cost of that specialization.
By identifying critical paths, defining meaningful health, connecting dependencies, converging the right data in Splunk, and designing dashboards around decisions, I/T can move beyond isolated truths toward a coherent understanding of the whole system. That is the Art of Observability.
Join Presidio at Splunk .conf for The Art of Observability, where we will explore the framework, design principles, and practical approach for turning fragmented visibility into a more connected way of operating.
|
JOIN PRESIDIO AT SPLUNK .CONF The Art of ObservabilityTuesday, September 15 | 1:30–1:50 PM |
Presidio and Splunk help organizations transform fragmented operational data into connected insight, faster decisions, and better outcomes.